Shareholder Return
Basic Policy on Return to Shareholders
The Company regards the return of profits to shareholders as a key management decision and has adopted a basic policy of maintaining sufficient internal reserves required for business growth from a medium- to long-term management perspective, while continually paying a stable dividend in consideration of its consolidated financial results.
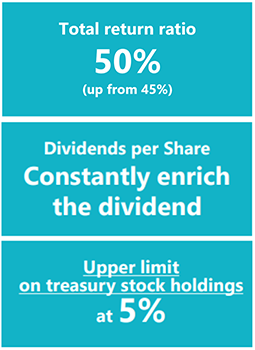
Through the medium-term management plan(2024-2026) , Balancing efforts to leverage growth investment, maintain financial health and strengthen return to shareholders,TIS will lay the groundwork for an increase in the total return ratio yardstick to 50%, from 45%, and constantly enrich dividends per share.
In so doing, the Company will raise shareholder engagement.
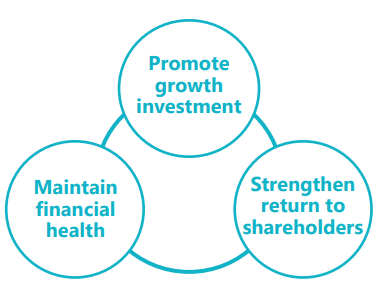
Promote growth investment
- Total growth investment of about ¥100 billion over three years
- Robust investment to optimize business portfolio
- Will pursue sustainable creation of returns exceeding cost of capital and broaden equity spread
Strengthen return to shareholders
- Raise total return ratio to 50% (yardstick) *from 45%
- Continue to enrich dividends per share
- Maintain upper limit on treasury stock holdings at 5% of total shares outstanding, and cancel the excess
Maintain financial health
- Allow debt-equity ratio up to 0.5, understanding optimization of capital structure comes with improved ability to generate cash
- Maintain "A rating"
- Maintain level of cash and deposits, plus commitment line, equivalent to two months' worth of sales
For details on medium-term management plan, go to Medium-term Strategies .
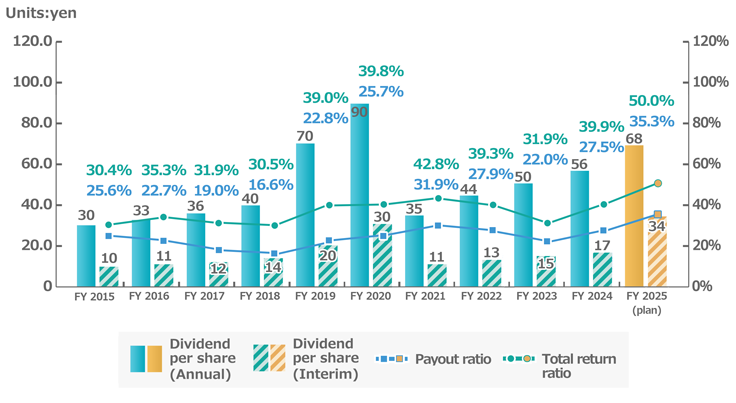
Dividends
The total return ratio is calculated excluding share repurchases conducted for the purpose of optimizing the capital structure. Separately, the Company conducted share repurchases for capital structure optimization in the fiscal years ended March 31, 2023, 2024, 2026, and 2027.
|
|
Dividend per share | Payout ratio | Total return ratio |
||
|---|---|---|---|---|---|
| (Interim) | (Year-end) | (Annual) | |||
| Fiscal 2027(plan) | 45 yen | 45 yen | 90 yen | 33.1% | 47.7% |
| Fiscal 2026 | 38 yen | 42 yen | 80 yen | 39.0% | 53.5% |
| Fiscal 2025 | 34 yen | 36 yen | 70 yen | 32.6% | 45.8% |
| Fiscal 2024 | 17 yen | 39 yen | 56 yen | 27.5% | 39.9% |
| Fiscal 2023 | 15 yen | 35 yen | 50 yen | 22.0% | 31.9% |
| Fiscal 2022 | 13 yen | 31 yen | 44 yen | 27.9% | 39.3% |
| Fiscal 2021 | 11 yen | 24 yen | 35 yen | 31.9% | 42.8% |
| Fiscal 2020 | 30 yen | 60 yen | 90 yen | 25.7% | 39.8% |
| Fiscal 2019 | 20 yen | 50 yen | 70 yen | 22.8% | 39.0% |
| Fiscal 2018 | 14 yen | 26 yen | 40 yen | 16.6% | 30.5% |
| Fiscal 2017 | 12 yen | 24 yen | 36 yen | 19.0% | 31.9% |
| Fiscal 2016 | 11 yen | 22 yen | 33 yen | 22.7% | 35.3% |
| Fiscal 2015 | 10 yen | 20 yen | 30 yen | 25.6% | 30.4% |
| Fiscal 2014 | 8 yen | 17 yen | 25 yen | 27.7% | 27.7% |
| Fiscal 2013 | 7 yen | 14 yen | 21 yen | 31.4% | 31.4% |
| Fiscal 2012 | - | 18 yen | 18 yen | 74.0% | 74.0% |
| Fiscal 2011 | 12 yen | 20 yen | 32 yen | 46.9% | 46.9% |
| Fiscal 2010 | 12 yen | 20 yen | 32 yen | 35.9% | 35.9% |
| Fiscal 2009 | - | 32 yen | 32 yen | 28.9% | 28.9% |
*No interim dividend was distributed in fiscal 2009 — the Company's first fiscal year — because the books for this inaugural term had not yet closed. The year-end dividend included a 5 yen per share bonus.
Share Repurchase
| Share repurchase period | Total number of shares acquired | Aggregate acquisition amount |
|---|---|---|
| March 11, 2026 - May 11, 2026 | 14,368,400 shares | 49,999,921,400 yen |
| May 9, 2025 - December 23, 2025 | 8,656,200 shares | 41,999,758,225 yen |
| May 9, 2024 - June 17, 2024 | 2,216,200 shares | 6,499,783,213 yen |
| February 5, 2024 - February 5, 2024 | 6,766,000 shares | 22,422,524,000 yen |
| May 10, 2023 - July 12, 2023 | 1,678,900 shares | 6,199,897,691 yen |
| May 12, 2022 - December 19, 2022 | 8,223,000 shares | 29,999,853,433 yen |
| May 13, 2021 - September 2, 2021 | 1,430,400 shares | 4,470,000,000 yen |
| May 13, 2020 - May 14, 2020 | 1,395,600 shares | 3,029,847,600 yen |
| May 14, 2019 - July 31, 2019 | 749,800 shares | 4,139,444,981 yen |
| May 11, 2018 - July 30, 2018 | 809,100 shares | 4,209,858,472 yen |
| May 11, 2017 - July 18, 2017 | 908,300 shares | 2,859,885,484 yen |
| May 11, 2016 - June 23, 2016 | 834,900 shares | 2,099,829,682 yen |
| October 30, 2015 - December 9, 2015 | 540,400 shares | 1,599,738,482 yen |
| May 12, 2014 - May 29, 2014 | 311,800 shares | 499,954,400 yen |
Cancellation of Treasury Stock
| Date of cancellation | Total number of shares to be cancelled |
Percentage of issued shares before the cancellation |
|---|---|---|
| February 27, 2026 | 7,833,411 shares | 3.3% |
| March 27, 2024 | 8,212,000 shares | 3.4% |
| February 28, 2023 | 6,715,483 shares | 2.7% |
| September 28, 2021 | 12,206,400 shares | 4.6% |
Preferential Treatment for Shareholders Program
The Company does not have a preferential treatment for shareholders program.